
Observe
Continuously evaluate telemetry, derived features, physics residuals and operating context.
Physics-first predictive intelligence for data centres and critical infrastructure. NeIO PIE combines equipment physics, synthetic fault trajectories and live telemetry to find developing faults, explain the evidence and help your teams act earlier.
Data centres already produce plenty of telemetry. Dashboards, threshold alarms and history-hungry models still leave operators reacting after degradation is visible.
Rules fire when one signal crosses a limit. Slow, interacting degradation stays hidden while every tag still looks acceptable.
New assets have no years of labelled site failures to train a conventional data-only model on.
Operators still cross-reference trends, alarms, maintenance history and engineering judgement before they can act.
Not more monitoring. Early, equipment-aware intelligence that tells normal variation from a developing fault.
Scrub the timeline. Threshold alarms wait for a limit; NeIO PIE flags the drift, names the probable fault and proposes the next step.
PIE compares live readings with the physics-expected band. No significant residual yet.
Illustrative interface · assets, values and warning horizons are for demonstration. Real lead time depends on signals, data quality, operating conditions and fault type.
Rank risk across sites, move from an alert to its probable diagnosis, then inspect the signals and features behind it.
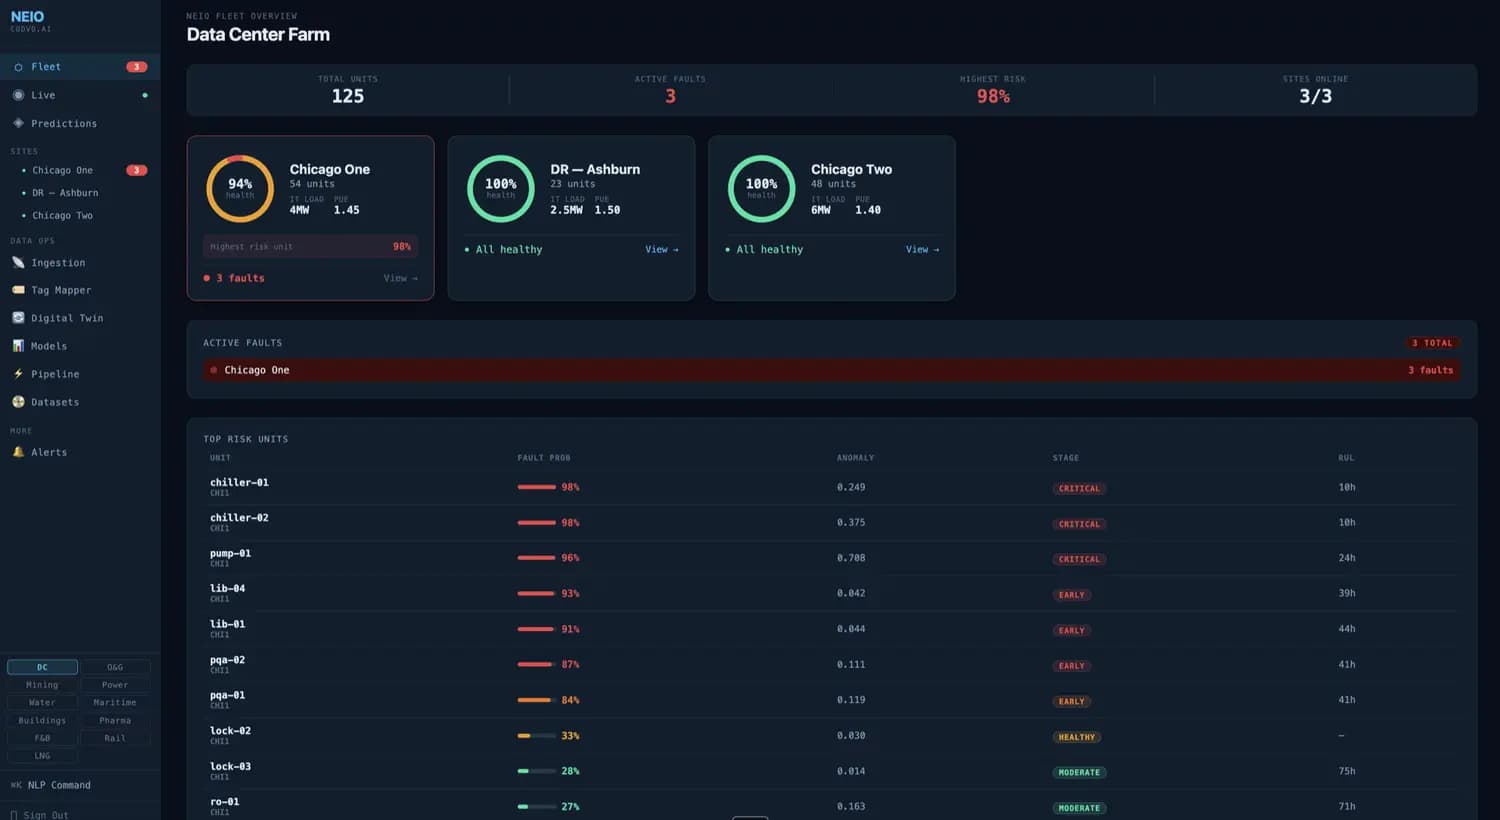
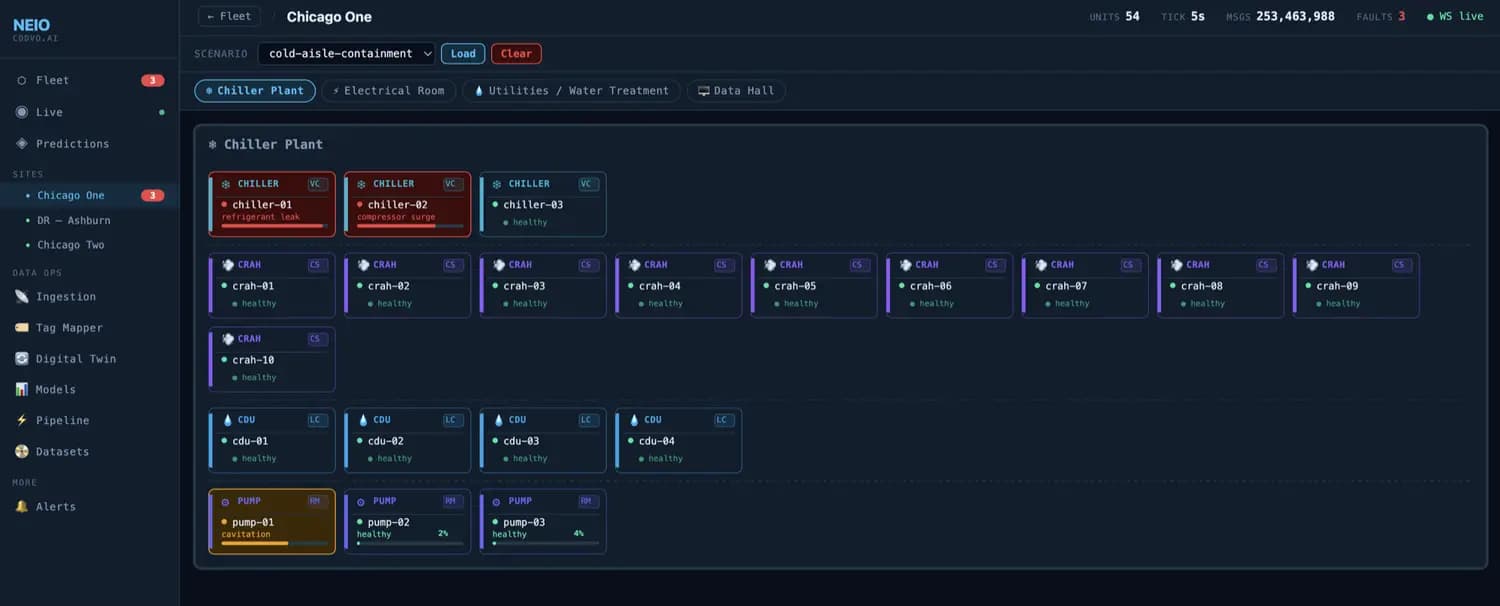
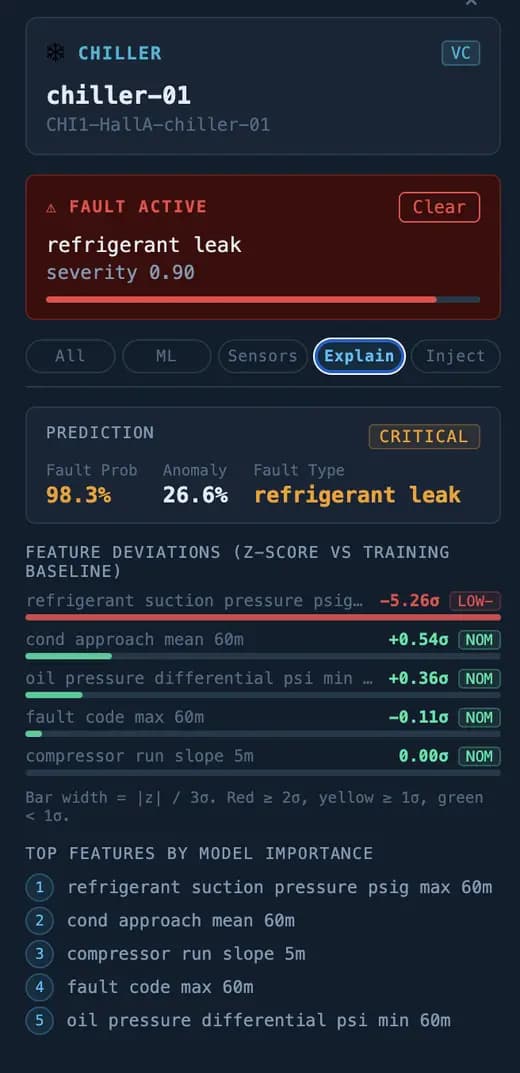
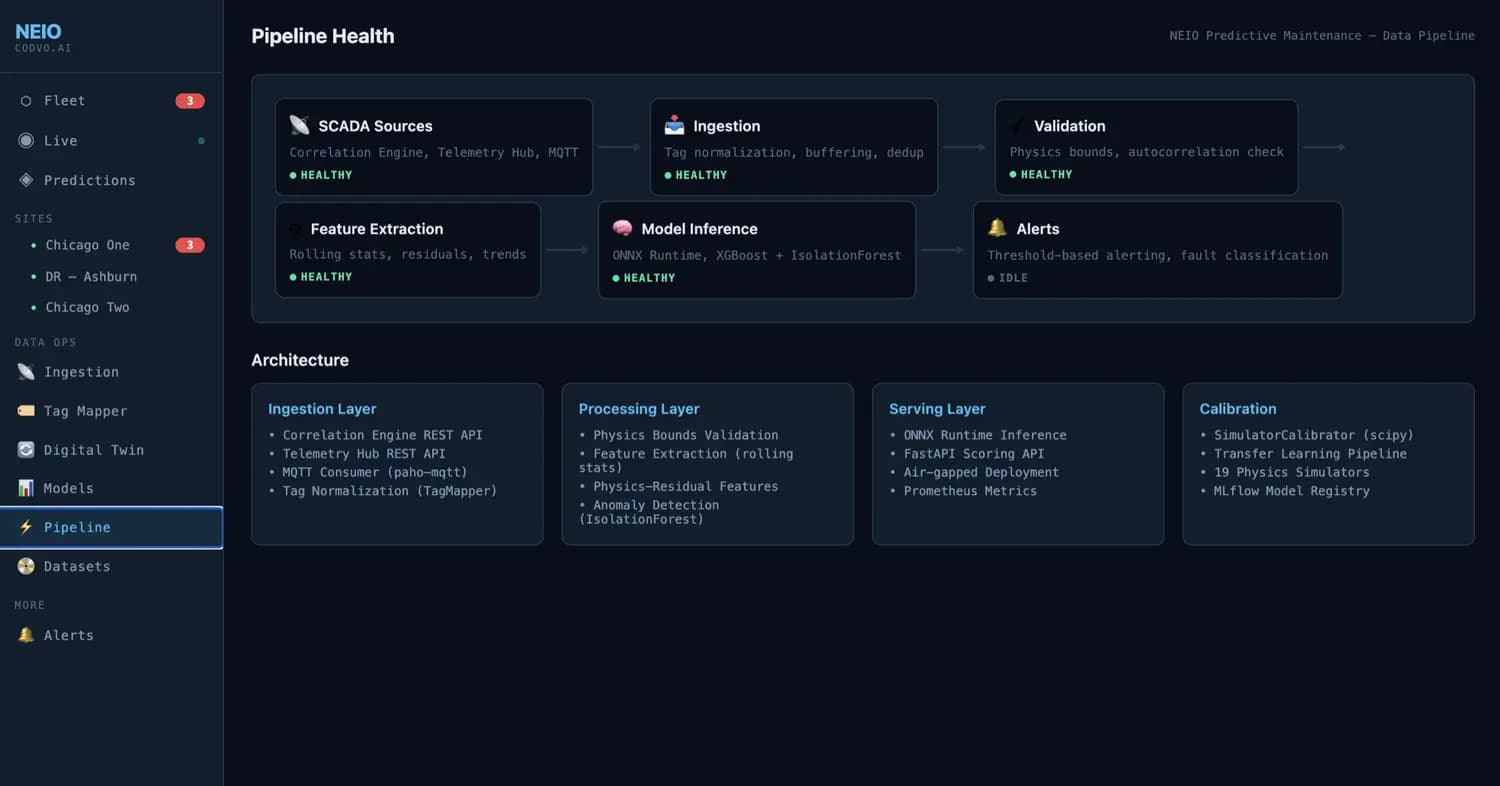
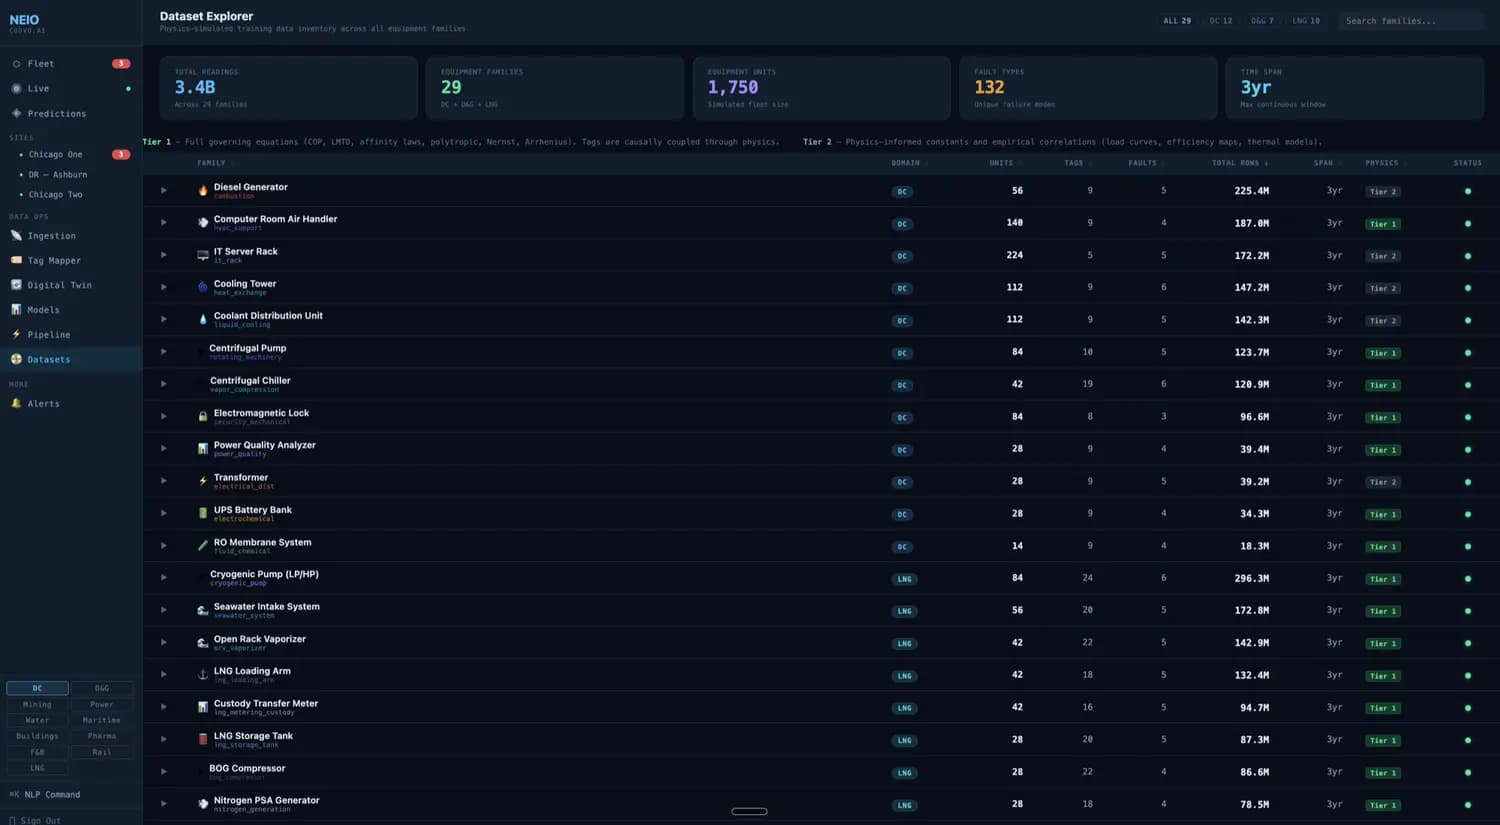
Platform views shown for illustration. Dataset breadth and available models depend on the configured release and customer scope.
PIE starts with the physics that governs the equipment. Synthetic fault trajectories give it a foundation; live telemetry calibrates it to your site.
Operating equations, engineering constraints and causal relationships define what healthy behaviour looks like for each equipment family.
Known degradation patterns are generated across operating conditions and failure stages, so the models see faults your site has not had yet.
A fault classifier and an anomaly detector per family, ready without waiting for a local failure corpus.
Live telemetry, operator feedback and governed model refinement tune the baselines to your equipment and operating envelope.
Coverage from day one. Physics and synthetic fault data mean the asset is protected while site history is still being built.
Conceptual illustration, not measured data.
An extensible starting library for 12+ equipment families, configured to the signals and environment you have.
Signals and signatures are configured to the telemetry available at your site.
*Ingestion cadence depends on source-system access, telemetry availability and implementation design.
Model output becomes an operating workflow, while control stays with your facilities, reliability and maintenance teams.
Continuously evaluate telemetry, derived features, physics residuals and operating context.
Correlate fault probability and novel anomalies into the most probable developing condition.
Show the contributing signals, feature deviations, stage, confidence and recommended next step.
Route approved intelligence to maintenance, operator response and work-order workflows.
Human-governed by design. Approval gates, traceability and role-based policies are configured to your environment.
Facilities, reliability, OT security and finance each see a different return from earlier, explainable warning.
Running live halls, chiller plants and electrical rooms
Top concerns
In a pilotRanked risk for your priority assets on one screen.
Owning PM plans, root cause and spares
Top concerns
In a pilotDiagnosis, stage and evidence for every flag.
Approving anything that touches operational data
Top concerns
In a pilotOn-prem or air-gapped, inside your boundary.
Weighing uptime risk against spend
Top concerns
In a pilotValue exposure estimated for each detected condition.
Deploy in customer-controlled infrastructure and add intelligence to systems your teams already trust, with no rip and replace.
Sensor data and inference stay inside the facility.
Designed for OT security review and operational continuity.
Containerised deployment on the platform you already run.
You own model, access and update governance.
Privacy & security. Runs on NeIO inside your boundary, under NeIO Govern controls. Advisory by design: no command is sent to your plant.
Read morePick a focused site and priority equipment families. We validate telemetry, set baselines and measure whether predictions are early, explainable and useful.
Scope, criteria and warning horizons are agreed per asset. Results depend on signal availability, data quality, operating conditions and fault type.
No. It is an intelligence layer that reads from approved data sources and hands results to your existing workflows. Your systems remain the systems of record and control.
Yes. Physics-informed models and synthetic fault trajectories provide the starting point, and live telemetry calibrates them to your site over time.
Telemetry from the selected equipment families through BMS, SCADA, OPC, historians or telemetry hubs. During the pilot we confirm which signals are available and usable.
Yes. Deployment can be on-premises or fully air-gapped, including containerised patterns such as Red Hat OpenShift, so sensor data and inference stay in your facility.
Every prediction shows fault probability, anomaly score, probable diagnosis and stage, plus the contributing features and their deviation from baseline.
No. Outputs are advisory. Hand-offs to maintenance or work-order systems go through approval gates you configure.
Bring one site and your priority equipment families. We'll scope a six-week pilot around them.